+24%
Higher National GDP by 2045 vs BAU
IDR 62,380 trillion vs. IDR 50,2 trillion under BAU.
 INDONESIA
Impact & Data
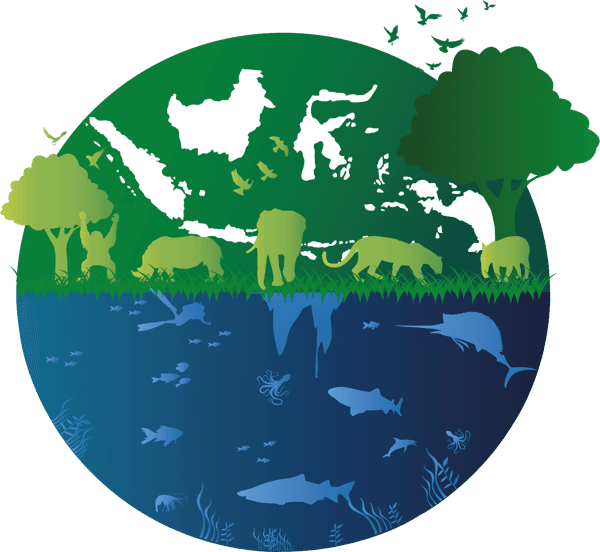
Biodiversity potential
Indonesia’s forest cover in 2024 according to the Ministry of Forestry — immense potential to supply raw materials for food, bioenergy, pharmaceuticals, cosmetics and various other biomaterial products. Portions of production forest areas continue to face productive utilization challenges due to limited legal access, infrastructure, and investment.
Forest area with a protective function.
Concession forest 32,4 million ha · non-concession forest 36,3 million ha · 590 PBPH units.
Area for the conservation of biodiversity.
The share of the world’s species that live in Indonesia.
Bar scale 0–100%.
Bioeconomy to support economic growth
Contribution of the agriculture, forestry, and fisheries sectors in 2024, with an absolute value reaching IDR 2.791.428 billion (Statistics Indonesia, BPS).
Share of national GDP, ranked.
Bar length relative to the highest value (9,52%).
Technology, research, and innovation
Indonesia’s rank in the Global Innovation Index (WIPO), 2020–2025. The lower the number, the better. In 2024 Indonesia ranked 54th out of 133 economies.
HRST 2023: ±445.521 human resources in science and technology (≈1.596 personnel per million inhabitants), ±95% in the higher education sector (BRIN).
Scenario projections · not measured data
+24%
IDR 62,380 trillion vs. IDR 50,2 trillion under BAU.
+40%
IDR 24,945 trillion from bioeconomy contribution (5 cluster).
25,2B TonC
25,2b ToC with IBI vs 11b ToC without intervention in 2045.
93,5%
83,0
+10% → +9%